In the fast-paced world of trading, every second matters, and sometimes, so does every fraction of a second. A trading tick is the smallest measurable price movement an asset makes during trading. While seemingly insignificant, these tiny changes hold powerful insights into market dynamics, giving traders a glimpse into real-time activity and trends. Understanding and leveraging trading ticks isn’t just a skill—it’s a strategy that can significantly enhance your ability to make profitable trades.
Imagine standing at the edge of a bustling marketplace where every shout, whisper, or gesture tells you something about what’s being bought, sold, and at what price. That’s essentially what trading ticks do—they’re micro-indicators of market movement. This guide will walk you through what trading ticks are, how they work, and the strategies you can use to turn them into a powerful tool for profit.
What Are Trading Ticks?
A trading tick is the smallest possible price movement of a financial asset, such as a stock, commodity, or currency. In other words, it’s the unit of measurement for price changes in the market.
For example:
- In the stock market, a tick could represent a 1-cent movement up or down.
- In the futures market, tick sizes vary depending on the contract, such as $0.25 for crude oil futures.
Ticks are foundational to understanding how markets operate. Each tick represents a transaction between buyers and sellers, giving you a microscopic view of the market’s activity.
Tick Size vs. Tick Value
It’s essential to distinguish between tick size and tick value:
- Tick Size: The smallest allowable price movement for a given asset.
- Tick Value: The monetary value of one tick’s movement, which depends on the asset and contract size.
Why Do Ticks Matter?
At first glance, ticks might seem too granular to matter, but they’re packed with information. Each tick tells a story about market activity—whether there’s more buying than selling, how quickly prices are moving, and whether the market is trending or range-bound.
- Real-Time Market Sentiment
Ticks provide traders with a real-time pulse of market sentiment. Rapid upward ticks might indicate bullish momentum, while successive downward ticks could signal bearish pressure. - Identifying Trends
By analyzing tick data, traders can identify emerging trends before they’re visible on traditional time-based charts. This gives you an edge in spotting opportunities early. - Volume Insights
Ticks often correlate with trading volume. A significant number of ticks in a short time suggests heavy market activity, which can precede big price movements.
How to Use Trading Ticks to Maximize Profit
Now that you understand ticks and their importance, let’s dive into how to use them effectively.
1. Scalping with Tick Charts
Scalping is a short-term trading strategy where you make quick trades to profit from small price movements. Tick charts, which display a specific number of transactions instead of time intervals, are ideal for this.
How it Works:
- A 100-tick chart, for example, will display a new candlestick every 100 trades, regardless of how much time has passed.
- This helps you focus on actual market activity rather than waiting for time-based intervals to complete.
Benefits of Scalping with Ticks:
- Allows for precise entries and exits.
- Captures small profits multiple times in a day.
Example:
A trader using a tick chart notices a pattern of rapid upward ticks followed by a brief consolidation. They buy during consolidation and sell when ticks resume their upward movement.
2. Trend Following with Tick Analysis
Ticks are excellent for confirming trends and spotting reversals. By combining tick data with technical indicators, you can better identify when to enter or exit trades.
Steps to Follow:
- Look for consistent upward or downward ticks to confirm a trend.
- Use indicators like moving averages or Bollinger Bands to validate your analysis.
- Watch for patterns like higher highs or lower lows within tick movements.
Why It Works:
Ticks provide a micro-level view of price action, helping you confirm whether a trend is genuine or a false breakout.
3. Tick-Based Risk Management
Effective risk management is the cornerstone of successful trading. Ticks can help you set precise stop-loss and take-profit levels.
How to Use Ticks for Risk Management:
- Calculate your risk per trade based on tick value.
- Use ticks to set dynamic stop-loss levels that adjust based on volatility.
For instance, if a market is moving quickly, you might widen your stop-loss to accommodate more ticks, reducing the risk of premature exits.
Tools and Platforms for Tick Analysis
To analyze trading ticks effectively, you’ll need the right tools. Modern trading platforms offer tick data, but the best ones go a step further with customizable charts, indicators, and analytics.
Recommended Platforms
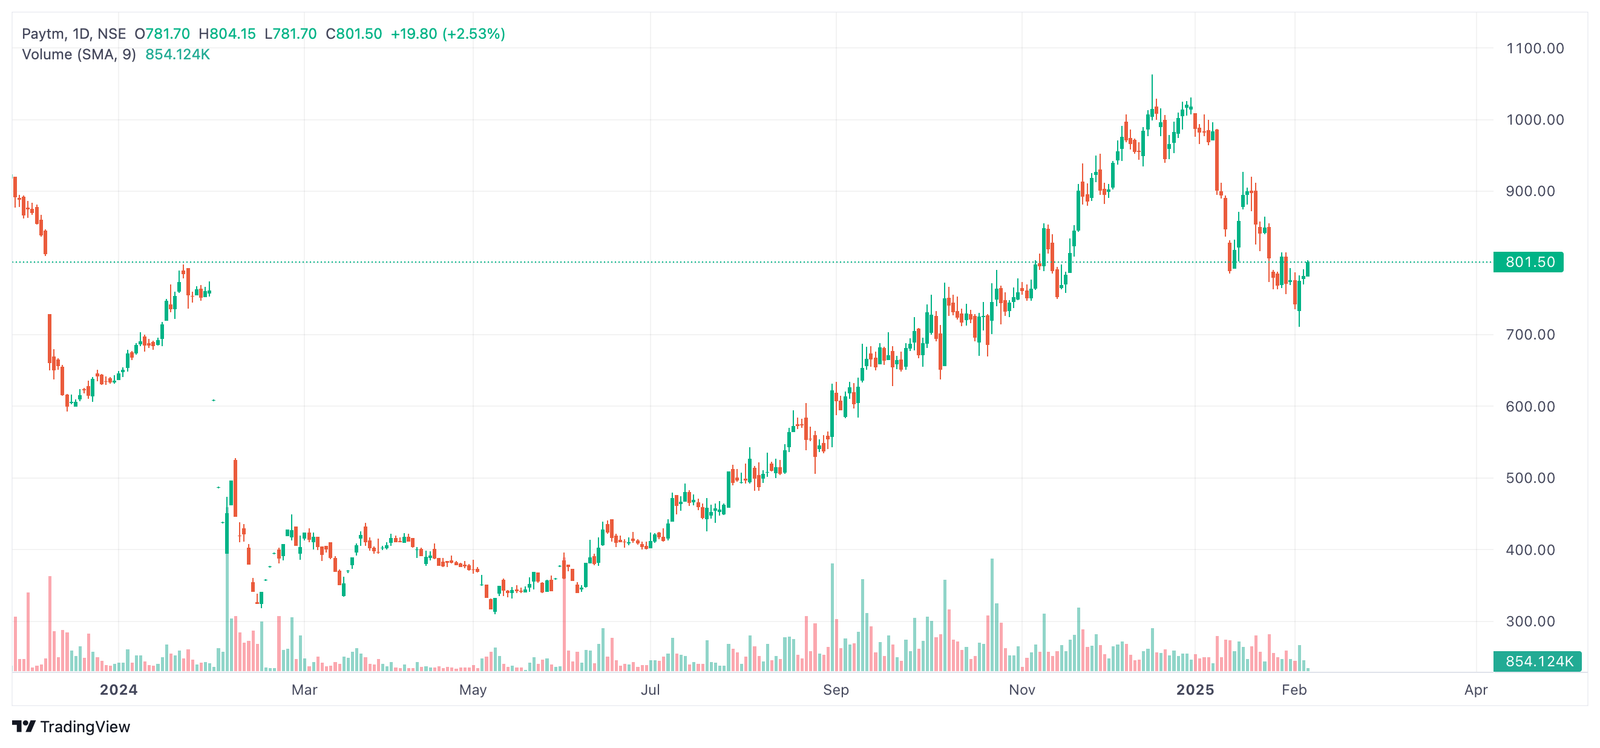
- TradingView: Known for its user-friendly interface and extensive charting tools.
- MetaTrader 5 (MT5): Popular among forex and futures traders for its real-time tick data and automation capabilities.
- Thinkorswim: Offers robust tick charts and analysis features tailored to active traders.
Essential Indicators for Tick Charts
- Volume Bars: Show the number of transactions behind each tick movement.
- Moving Averages: Help smooth out tick noise and reveal trends.
- Bollinger Bands: Indicate volatility and potential breakout points.
Overcoming Common Challenges
Trading with ticks isn’t without its challenges. Here are some common pitfalls and how to overcome them:
- Dealing with Noise
Tick data can be noisy, especially in highly liquid markets where transactions occur rapidly. To avoid getting overwhelmed:
- Focus on patterns rather than individual ticks.
- Use filters like moving averages to smooth out data.
- Avoiding Overtrading
The speed of tick data can tempt traders to overtrade, leading to unnecessary losses. Stick to your strategy and avoid impulsive decisions. - Managing Emotions
Watching tick movements in real-time can be stressful. Practice discipline and remember that not every tick requires action.
Real-Life Examples
High-Frequency Trading (HFT)
HFT firms use algorithms to analyze tick data and execute trades in milliseconds. While individual traders can’t match their speed, you can learn from their precision.
Everyday Trader Success
A retail trader using tick charts notices an increase in upward ticks during a consolidation phase. They buy just before a breakout, making a profitable trade based on their tick analysis.
Conclusion
Trading ticks may seem small, but their impact on your trading strategy can be monumental. They offer a real-time view of market activity, helping you make smarter, more informed decisions. By incorporating tick-based strategies like scalping, trend following, and risk management, you can leverage these tiny price movements to maximize your profits.
Start by experimenting with tick charts on a demo account, get familiar with their nuances, and build your confidence. With practice and the right tools, you’ll unlock the full potential of trading ticks and take your trading game to the next level.